Explore the Gujarat Board Statistics Class 11 GSEB Solutions for Chapter 2, Exercise 2.1, focusing on “Presentation of Data.”
This resource offers precise answers to Gujarat Board Textbook Solutions, aiding students in mastering the art of data presentation.
It serves as a valuable tool for a comprehensive understanding of statistical concepts in the Class 11 curriculum.
Chapter 1 Collection of Data Ex 1
Gujarat Board Textbook Solutions Class 11 Statistics Chapter 2 Presentation of Data Ex 2.1
Question 1.
The data regarding the number of children of 50 families residing in a certain area are given below. Prepare an appropriate frequency distribution.
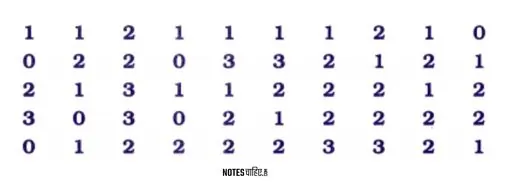
Answer 1.
The given data represents the number of children in 50 families.
Since the number of children is a discrete variable, we create a discrete frequency distribution with the number of children (x) and the number of families (f).
The data ranges from a minimum of 0 children to a maximum of 3 children.
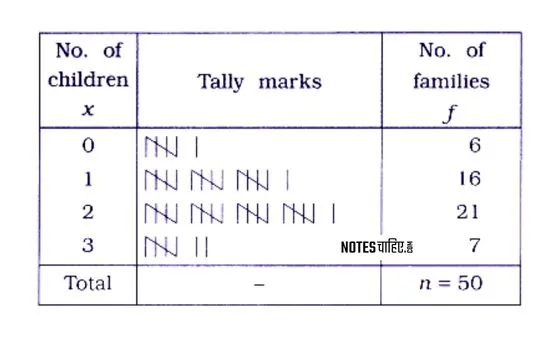
Discrete frequency distribution showing the number of children in 50 families
Question 2.
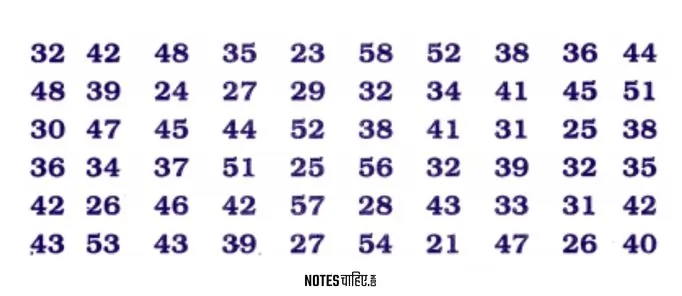
The ages (in full years) of 60 employees working in an office are registered as follows.
Prepare a frequency distribution by taking class length as 5 from this information.
Answer 2.
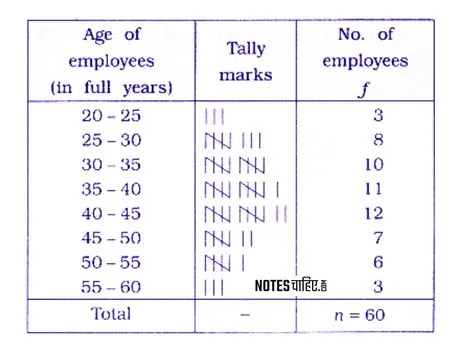
The given data describes the age distribution of 60 employees in an office.
The age ranges from a minimum of 21 years to a maximum of 58 years, with a class length of 5.
The initial class is 20–25, and the final class is 55–60 in this continuous frequency distribution.
Question 3.
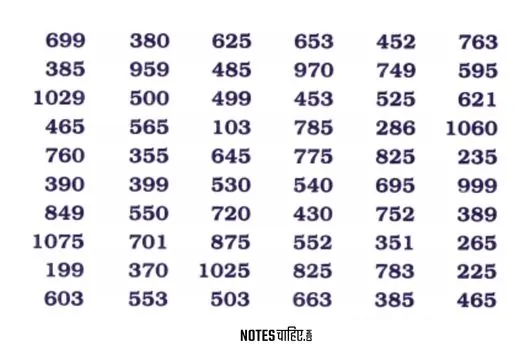
The data regarding the number of mobile phones produced during last 60 days by a mobile phone manufacturing company is given below. Distribute it into 10 classes.
Answer 3.
In the provided dataset on mobile production, the minimum and maximum values are 188 and 1075, respectively, resulting in a range (R) of 887 mobiles.
With the aim of creating a frequency distribution with 10 classes (k), the class length (c) is determined using the formula:
class length c = $\frac{R}{k}$ = $\frac{887}{10}$ = $88.7 \approx 89$
If we consider c = 89, the calculated value for ( ck ) (class width multiplied by the number of classes) is ck=89×10 = 890 . And ck>R.
This exceeds the range ( R ) of the data, indicating that the selected class width is too large.
For practical considerations, a rounded value that is a multiple of 10 is preferred. Thus, ( c = 100 ).
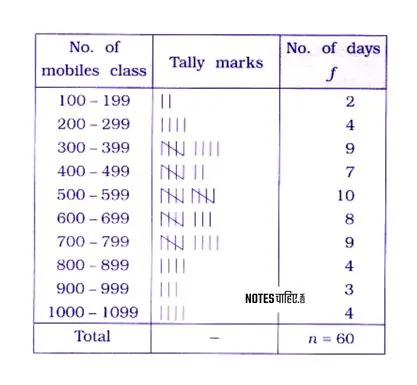
Now, the inclusive continuous frequency distribution is established with initial class 100-199 (inclusive) and the final class 1000-1099 (inclusive), accommodating the entire range of data.
Inclusive continuous frequency distribution, showing the production of mobiles during 60 days
Explanation:
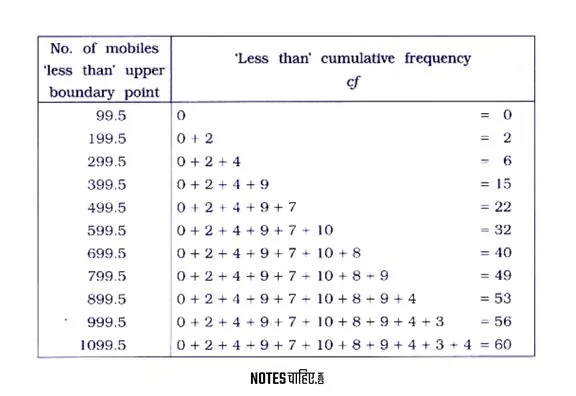
To compute the cumulative frequency distribution for both ‘less than’ and ‘more than’ cases, we calculate the lower class boundary point and upper class boundary point for each class.
For the initial class 100-199:
Lower class boundary point:
=$\text{Lower limit} + \frac{\text{Difference between consecutive lower limits}}{2} $
= $100 + \frac{99 – 0}{2} $
= 99.5
Upper class boundary point:
=$\text{Upper limit} + \frac{\text{Difference between consecutive upper limits}}{2}$
= $199 + \frac{200 – 100}{2}$
= 199.5
Alternatively, using the formula:
$\frac{{\text{{upper limit}} – \text{{lower limit}}}}{2}$
Lower boundary point: $\text{Lower limit} + \frac{1}{2} = 99.5$
Upper boundary point: $\text{Upper limit} + \frac{1}{2} = 199.5 $
Less than’ type cumulative frequency distribution
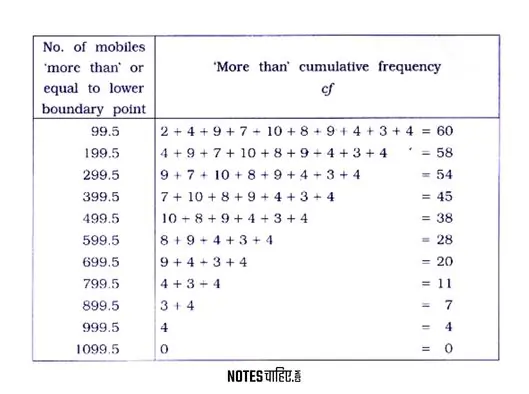
‘More than’ type cumulative frequency distribution
Question 4.
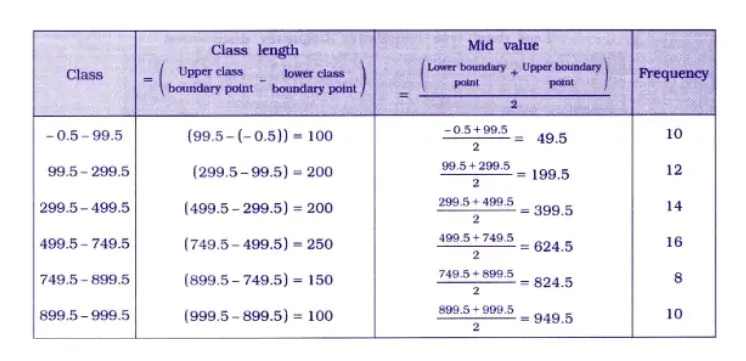
Rewrite the following frequency distribution by stating class length and Mid Value of each class
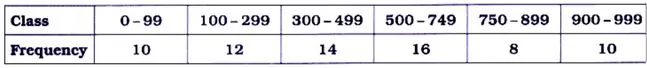
Answer 4.
For an inclusive-type frequency distribution with an interval width of 1:
- Lower Boundary Point (LB) = Lower Limit – 0.5
- Upper Boundary Point (UB) = Upper Limit + 0.5
Question 5.
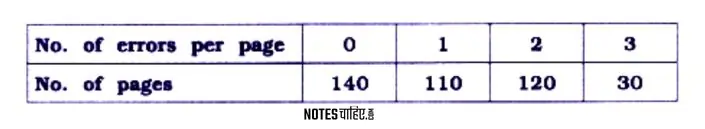
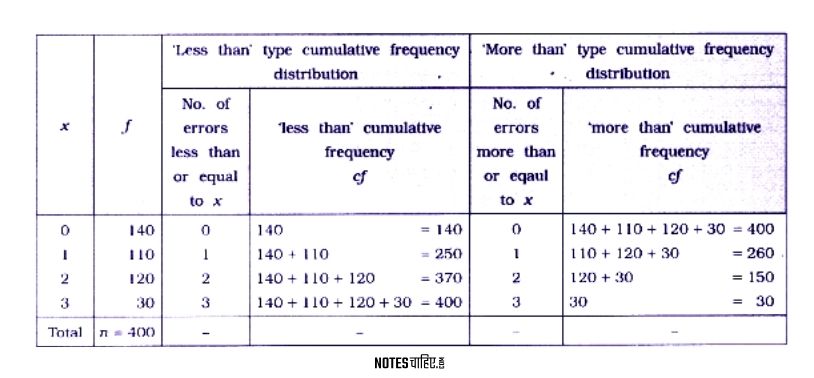
From the following frequency distribution, obtain ‘less than’ and ‘more than’ type cumulative frequency distributions :
Answer 5:
x = No. of errors per page, f = No. of pages
Question 6.
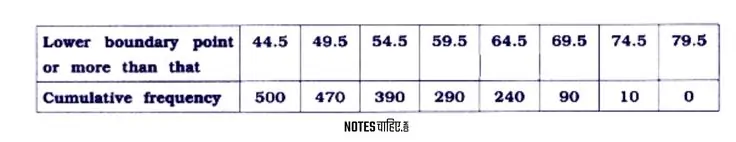
Obtain an inclusive continuous frequency distribution from the following data:
Answer 6.
Determine Class Length:
$$\text{Class Length} = \text{Upper Boundary Point} – \text{Lower Boundary Point} = 54.5 – 49.5 = 5$$
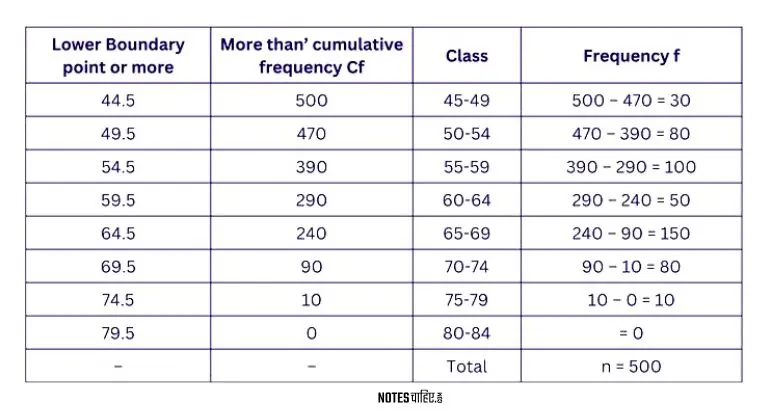
Find Initial Class Limits for Inclusive Form:
$$\text{Initial Class Lower Limit} = 44.5 + 0.5 = 45$$
$$\text{Initial Class Upper Limit} = 49.5 – 0.5 = 49$$
Therefore, the initial class in inclusive form is (45-49).
Calculate Frequency for Each Class:
$\text{Frequency of a Class} = (\text{‘More Than’ Cumulative Frequency of a Class}) – (\text{‘More Than’ Cumulative Frequency of Immediate Following Class})$
For the initial class (45-49):
$$\text{Frequency for 44.5} = (500 – 470) = 30$$
Repeat this process for the rest of the classes to obtain the complete inclusive continuous frequency distribution.
The inclusive continuous frequency distribution for the given data is obtained by adjusting the initial class limits and calculating the frequency for each class using the ‘more than’ cumulative frequencies.
Question 7.
Obtain an exclusive continuous frequency distribution from the following data:
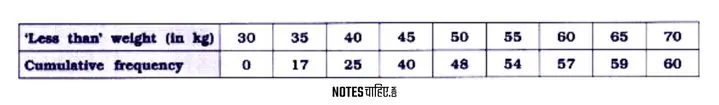
Answer 7.
Given data is ‘less than’ type cumulative frequency distribution.
Class Length:
Class Length = Upper Boundary Point−Lower Boundary Point
                        = 35−30
                        = 5
∴ For initial class,
Lower Boundary Point:
Lower Boundary Point = Upper Boundary Point−Class Length
                                          = 30−5
                                          = 25
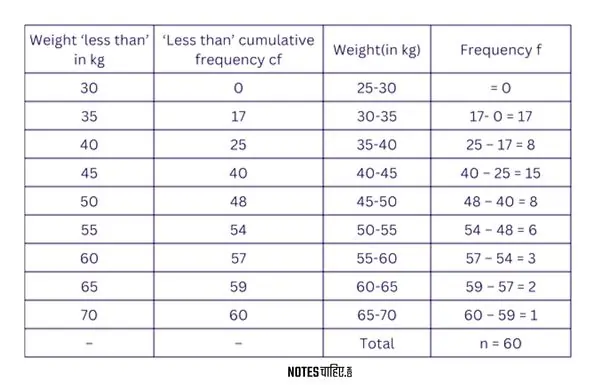
Class Identification:
Class = Lower Boundary Point−Upper Boundary Point (- not minus)
Initial class: 25−30
Frequency Calculation:
Frequency of a class = (‘less than ‘ cumulative frequency of a class) – (‘less than’ cumulative frequency of preceding class)
Calculation for upper boundary point 35: 17−0=17
In this manner, we will obtain the class frequency for each upper boundary point.
For the given data exclusive continuous frequency distribution is obtained as follows:
Question 8.
Obtain the original frequency distribution.
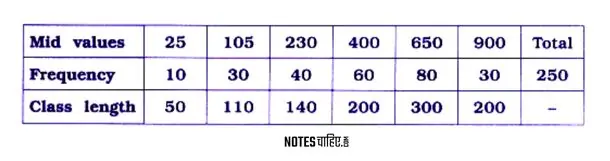
Answer 8.
In the given data, mid values and class length are given. We will find the lower limit and upper limit of a class as follows :
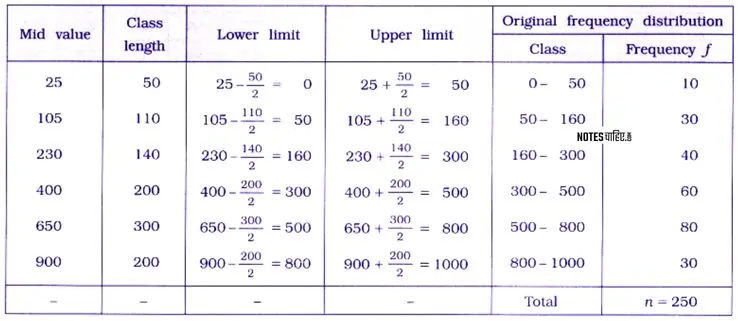
Lower Limit:
- $\text{{Lower Limit}} = \text{{Mid Value}} – \frac{{\text{{Class Length}}}}{2}$
= $ 25 – \frac{{50}}{2}$
= 0
Upper Limit:
- $\text{{Upper Limit}} = \text{{Mid Value}} + \frac{{\text{{Class Length}}}}{2}$
=$25 + \frac{{50}}{2} $
= 50
Class Identification:
$\text{{Class}} = \text{{Lower Limit}} – \text{{Upper Limit}}$
∴ For mid value 25, we get the class 0 – 50.
Repeat steps for each subsequent mid value to obtain the corresponding lower limit, upper limit, and class.
Thus, original frequency distribution is obtained as follows:
Question 9.
Information regarding the number of accidents in a city during a year is as under. Find the inclusive continuous frequency distribution from it.
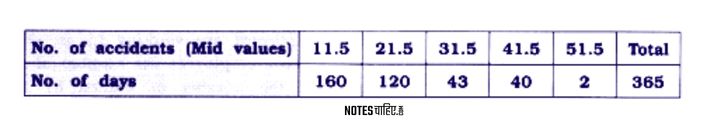
Answer 9.
In given data, mid values of class and their frequency are given.
The difference between two adjoining mid values is 10.
∴ class length =10
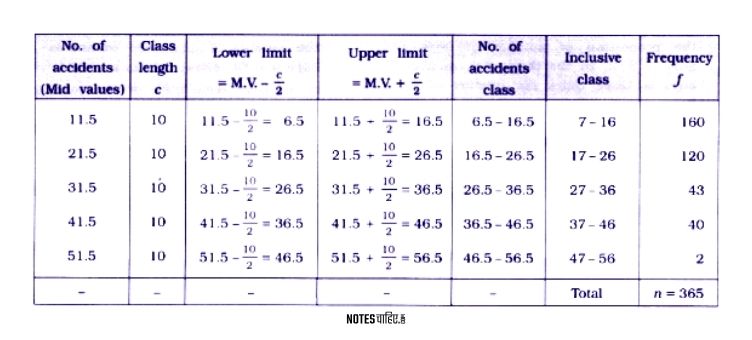
Note : For inclusive class :
Lower boundary point = Lower limit + 0.5;
Upper boundary point = Upper limit – 0.5
Question 10.
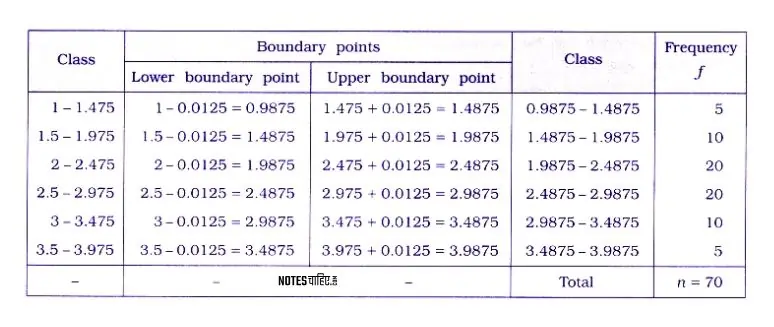
From the following data, obtain class boundary points from the class limits and write the frequency distribution:
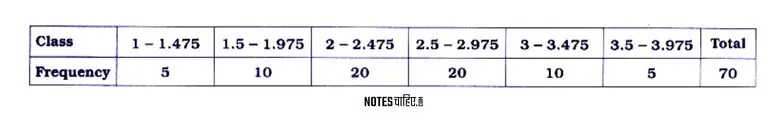
Answer 10.
Identify Class Interval Difference:
- The difference between the upper limit of a class and the lower limit of its immediate next class is 0.025.
Example Calculation:
- For instance, in the data, the upper limit of 1-1.475 is 1.475, and the lower limit of 1.5-1.975 is 1.5.
- Difference Calculation: (1.5 – 1.475 = 0.025).
Boundary Point Calculation:
- Subtract 0.025/2 = 0.0125 from the lower limit to obtain the lower boundary point.
- Add 0.025/2 = 0.0125 to the upper limit to obtain the upper boundary point.
The lower boundary point and upper boundary point of the classes are derived through these calculations.