Gujarat Board GSEB Statistics Class 11 Solutions Chapter 2 Presentation of Data Ex 2.2 Textbook Exercise Questions and Answers.
GSEB Class 11 Statistics Ch 2 Presentation of Data Ex 2.1
GSEB Textbook Solutions Class 11 Statistics Chapter 2 Presentation of Data Ex 2.2
Question 1.
There were 1400 students studying in a commerce college. Among them, 855 were boys and of them, 225 boys were in the second year. In the second year, the number of boys and the number of girls are equal. Among the 550 students of the first year, the proportion of number of boys and girls is 3:2. In the third year, number of boys is three times the number of girls. Represent the above information in a table.
Answer 1.
In the given data, there are two attributes :
- Year of study and
- Sex of students.
| Year of study | Sex | No. of students | |
| Boys | Girls | ||
| First year | 330 | 220 | 550 |
| Second year | 225 | 225 | 450 |
| Third year | 300 | 100 | 400 |
| Total | 855 | 545 | 1400 |
Explanation:
- In the first year, the ratio of boys to girls is 3:2, so
boys = $\frac{3}{5} \times 550 = 330$ and
girls = $\frac{2}{5} \times 550 = 220$ - In the second year, the number of boys and girls are equal, and 225 boys are in the second year.
Number of Students in Third Year:
- The total number of students is 1400.
- The number of students in the first year is 550, and in the second year is 450.
- Therefore, the number of students in the third year is calculated by subtracting the sum of first and second-year students from the total: (1400 – (550 + 450) = 1400 – 1000 = 400).
Proportion of Boys to Girls in Third Year:
- The given information states that the number of boys in the third year is three times the number of girls.
- The proportion of boys to the total (boys and girls) is (3:4) because (3 + 1 = 4).
- So, the number of boys is $\frac{3}{4} \times 400 = 300$.
- The number of girls is $\frac{1}{4} \times 400 = 100$.
In the third year, the number of boys is three times the number of girls, so
boys = $3 \times$ girls.
In summary, in the third year, there are 400 students, with 300 boys and 100 girls, forming a ratio of 3:1. These figures are obtained through simple calculations as explained above.
Question 2:
1600 employees are working in an office. Among these employees the number of men exceeded the number of women by 15% of the total number of employees. The number of unmarried employees are 800 less than the number of married employees. The number of unmarried women is 195. Represent the above data in a suitable table.
Answer 2.
The data has two attributes:
1. sex and
2. marital status.
It is classified into a table showing the number of employees based on these attributes.
| Marital Status | Sex | Total Employees |
|---|---|---|
| Married | Male | 715 |
| Female | 485 | |
| Unmarried | Male | 205 |
| Female | 195 | |
| Total | 1600 |
Explanations:
Distribution of Males and Females:
- Let the number of males be ( x ).
- Number of females: 1600 – x
- The number of males is 15% more than the number of females.
- x = 1600 – x + $\frac{15}{100} \times 1600$
∴ x = 1600 – x + 240
∴ 2x = 1840
∴ x = 920
∴ No. of females = 1600 – 920 = 680
Distribution of Marital Status:
- Let the number of married employees be ( x ).
- Number of unmarried employees: 1600 – x
- Number of unmarried employees is 800 less than the number of married employees.
- 1600 – x = x – 800
∴ 2x = 2400
∴ x = 1200 - Number of unmarried employees: 1600 – 1200 = 400
In summary, the table represents the distribution of 1600 employees based on their sex and marital status, and the figures in bold are obtained through the provided calculations.
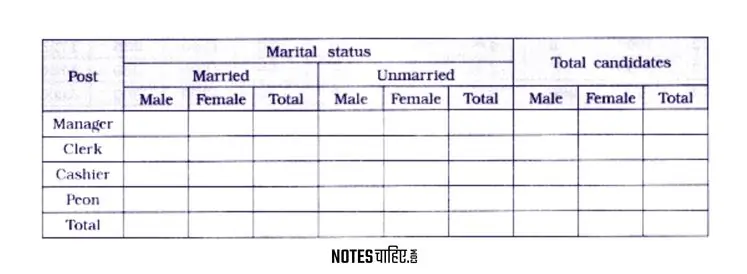
Question 3.
Prepare a blank table by considering the following characteristics for the candidates who appear for the different jobs at a bank:
(1) Designation: Manager, clerk, cashier, peon.
(2) Marital status: Married, unmarried.
(3) Gender: Male, female.
Answer 3.
Question 4.
Out of total 1850 women working in a factory, 549 were residing in labour area. Out of total married women of labour area, 250 had experience and 93 were inexperienced. The number of experienced and inexperienced women from other area were 87 and 400 respectively. The total number of inexperienced women was 1336 and out of them, 136 were from labour area. Out of total women, 1020 were unmarried. Among them, the number of experienced women from labour area and from other area were 163 and 14 respectively. Present these data in tabular form.
Answer 4.
The information we have is about women working in a factory, and we’re looking at three things: where they live, their marital status, and how much work experience they have.
The data is organized in a table.
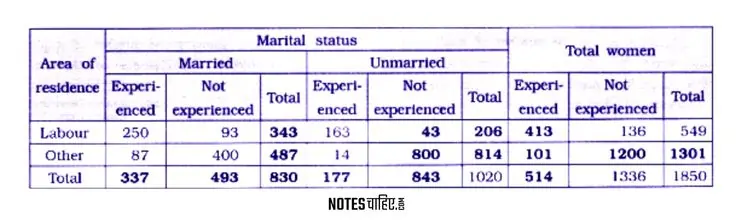
[Note: The figures shown in bold are obtained by simple calculation.]
Question 5.
There were 1250 skilled and 400 unskilled workers in a private company in the year 2011. There were 220 female workers and of them, 140 were unskilled. In the year 2012, the number of skilled workers was 1475 and of them, 1300 were males. Out of 250 unskilled workers, 200 were males. In 2013, there were 1700 skilled and 50 unskilled workers. Out of total workers, 250 were females of them 240 were skilled. In the year 2014, there were 2000 workers and of them 2 % were unskilled. Out of total workers, 300 were females and of them, 10 were unskilled. Present the above data in the form of table.
Answer 5.
The data classifies workers from 2011 to 2014 based on the attributes of Year, Training (Skill, Unskilled), and Sex (Male, Female).
The provided table details the number of workers in a private company during these years.
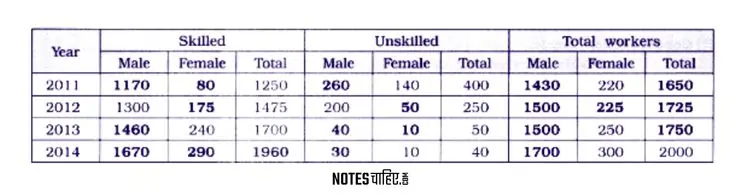
Explanation
2011:
Total Workers:
- Skilled Workers = 1250
- Unskilled Workers = 400
- Total Workers = Skilled + Unskilled = 1250 + 400 = 1650
Female Workers:
- Number of Female Workers = 220
Male Workers:
- Number of Male Workers = Total Workers – Female Workers = 1650 – 220 = 1430
Unskilled Workers:
- Number of Unskilled Workers = 400
- Number of Unskilled Female Workers = 140
- Number of Unskilled Male Workers = Total Unskilled Workers – Unskilled Female Workers = 400 – 140 = 260
- Skilled Workers:
- Number of Skilled Female Workers = Female Workers – Unskilled Female Workers = 220 – 140 = 80
- Number of Skilled Male Workers = Male Workers – Unskilled Male Workers = 1430 – 260 = 1170
2012:
Total Workers:
- Skilled Workers = 1475
- Unskilled Workers = 250
- Total Workers = Skilled + Unskilled = 1475 + 250 = 1725
Skilled Workers:
- Number of Skilled Female Workers = Skilled Workers – Male Skilled Workers = 1475 – 1300 = 175
Unskilled Workers:
- Number of Unskilled Female Workers = Unskilled Workers – Male Unskilled Workers = 250 – 200 = 50
The same process can be followed for 2013 and 2014. For more details, you can refer to the provided link.
Leave a Reply